Improving performance in your games using spritesheets
- 4 Min. Read.
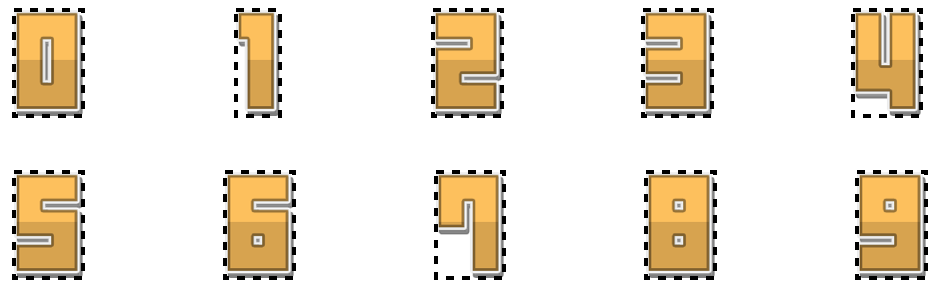
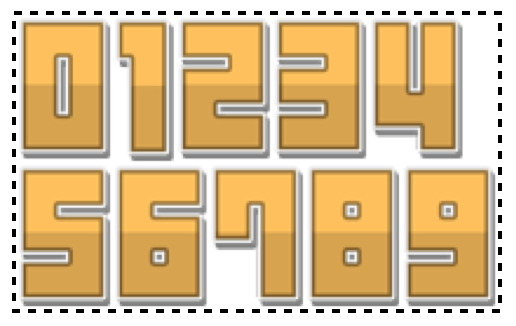
In this post we’ll focus on improving performance in your games, by making use of spritesheets. When using separate assets in your game, the amount of draw calls your GPU needs to make is huge. This has a big performance impact and can lead to framedrops, which we want to avoid at all times. Let’s assume we have these separate assets for creating a counter:
Let’s take a look at the number 1 in particular:
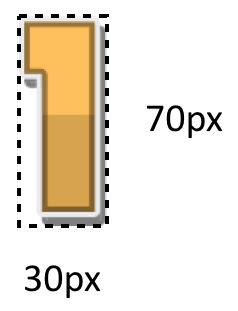
As you can see, this asset measures 30×70 pixels, but in many cases your GPU expects an asset to be in a specific format:
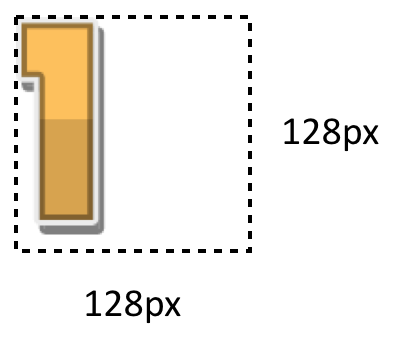
This results in a lot of wasted space, as the asset needs to be padded with extra, empty pixels:
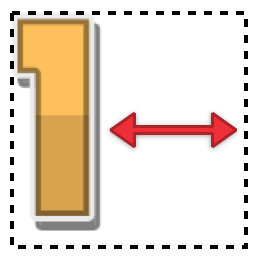
This happens for every asset, which results in a big amount of wasted space! Now, instead of letting all this space go to waste, we fit in some more assets:
When using separate assets, your GPU has to swap out the assets every time it needs to draw something on screen. This has a huge performance hit, which gets eliminated by the use of spritesheets. A spritesheet typically consists of 2 files:
- The texture file: the image assets, packed into a single sheet (png, jpeg, gif, …)
- The data file: Coordinates, names and attributes for each frame in the spritesheet (xml, json, …)
You can use programs like TexturePacker or even Adobe Flash to create these spritesheets.
Now how would one measure the FPS and draw calls?
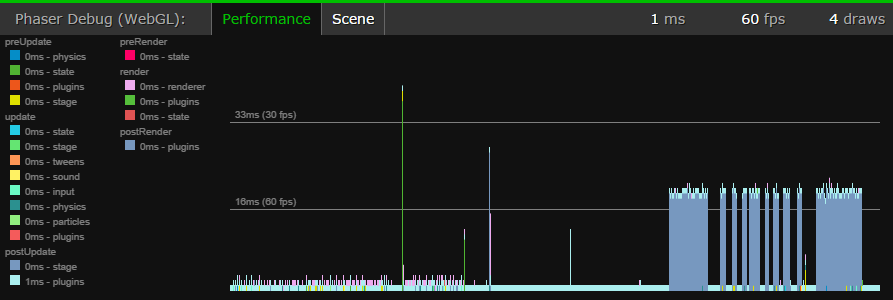
When it comes to measuring the FPS and draw calls, it all boils down to which platform or framework you’re using. Google Chrome featured an experimental canvas profiler, but unfortunately, it has been removed as of mid-2015.[src] Chrome still features many performance & profiling tools in the dev tools which will help you spot the performance issues. When using PhaserJS you can use the Phaser Debug Module, which will add a nice bar to your screen.
If you’re using Spritekit, Cocos2D or Sparrow instead, you can use the numerous debugging tools Xcode provides for you (ranging from the built-in framerate & draw call monitor, to measuring performance using Instruments).
Show me some numbers!
In our free PhaserJS Course where we create the TapTapTaxi game we had around 90 draw calls without spritesheets. Older devices (especially the second generation iPad) were struggling to keep a framerate of 60fps and framedrops occurred far too often.

When we implemented our spritesheet, the draw calls were reduced to about 20! That’s an improvement of over 75%. With this improvement, even the iPad 2 runs the game smoothly at 60fps!

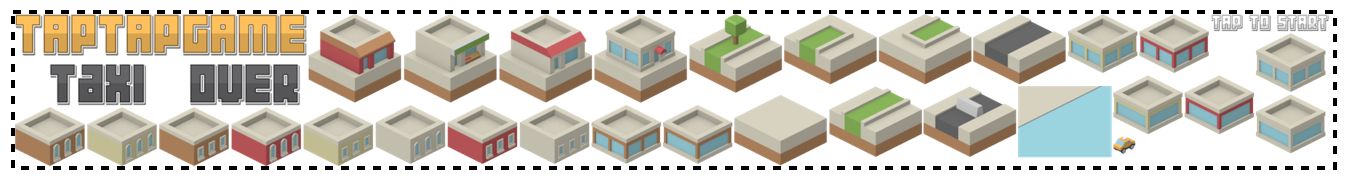
In the end, our final spritesheet looked like this:
Final word
Stop using separate assets for your game, and start creating spritesheets, you (and the players of your game) will thank me later!